We’ll talk a little bit about statistics in this post and learn how to find R2 in Google Sheets. The first query that comes up is: What is R2 and why is it necessary? R2 or R-squared, to put it technically, is the percentage of the response variable’s variance that the predictor variable can account for. The number known as its R-squared, or r2, indicates how well a linear regression model fits a given dataset.
The fact that the value of R2 can only range from 0 to 1 is another crucial piece of information. The answer values cannot be characterized or explained by the predictor variable, as indicated by the zero value (0). All other values may range from “can’t explain” to “can explain” to “can perfectly explain.” The single number (1) indicates that the response value can exactly explain or describe the predictor value. I hope you now have a basic understanding of what R2 is. Fortunately, Google Sheets comes with a native built-in formula to compute R2, and we’ll see its straightforward syntax below.
What is R2 in Google Sheets?
The degree to which a linear regression model “fits” a dataset perfectly is measured by R-squared or R2. It made use of two variables: a response variable and a predictor variable. A highly helpful statistical term for predicting outcomes and ensuring that the data points match the entire dataset is R2, which is utilized in both machine learning and statistics to work with linear regression.
R2, sometimes referred to as the coefficient of determination, is the percentage of the response variable’s variation that, depending on its value, can be accounted for by the predictor variable. R2 has a range of 0 to 1, with values closer to 1 indicating that the predictor variable can accurately explain the response variable.
You may also like>>> How To Multiply In Google Sheets [Full Guide]
How to Find R2 in Google Sheets?
Let’s first explore the theoretical idea underlying R2. Assume you have a dataset comprising the population and number of dairy stores in thirty US cities. With population size acting as the predictor variable and dairy shops acting as the response variable, you now have a basic linear regression model for the dataset. R2 = 0.2 is shown in the regression result’s output. This suggests that the population size accounts for 20% of the variation in the number of dairy shops. To better comprehend its applicability and utilization in the actual world, let’s do it practically.
How to Find R2 in Google Sheets – Example# 1
Here, I have the data for 10 employees who worked x hours a month and received y in salary at the end of the month. We will see sample data in this example and compute the R2 for that data. We shall calculate R2 for this data set.
Suppose that we now wish to include a basic linear regression model with “salary” serving as the response variable and “hours worked” as the predictor variable.
The =RSQ() function in Google Sheets is a native built-in function that allows us to find the R2 value for a certain dataset that needs to have at least two variables. We can use this function to find the R2 for this model.
Syntax:
RSQ(data_y, data_x)
data_y: The data range is what the array or matrix of dependent data is represented by.
data_x: It is the range that depicts the independent data matrix or array.
Note: The function will disregard any text value(s) that appeared in the arguments that were supplied.
Step 1>
Dummy Data.

Step 2>
In any cell, write the =RSQ function.

Step 3>
Give the first argument—the predictor variable’s data range.

Step 4>
Give the response variable’s data range as the second argument.

Step 5>
When you hit the Enter key, a value between 0 and 1 will appear.
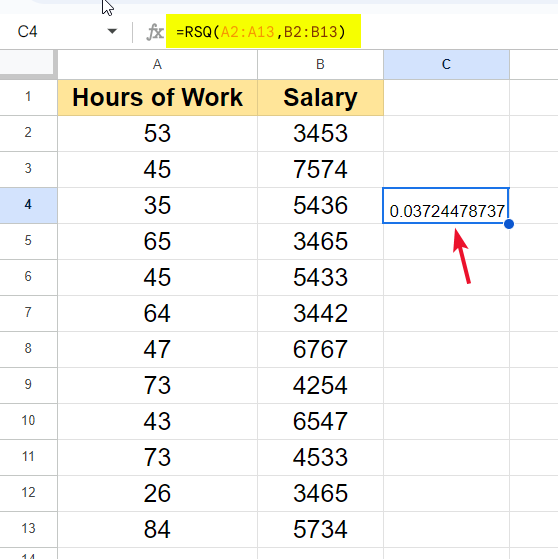
Our sample data set yielded an R2 score of 0.037.
To observe how the values change and affect the R2 value, you can change the values at random.

This indicates that the number of hours worked accounts for 18.3% of the variation in the salary array.
I hope this sample is useful to you. Thus, we obtain R2, the dataset’s Pearson product-moment correlation coefficient.
How to Find R2 in Google Sheets – Example# 2
This section will provide an additional example of utilizing Google Sheets’ built-in RSQ function to find R2. Similar to the last example, but with more potential for variation because each student has a different learning style and memory, we have a data set with 12 students, their study hours, and their final exam score out of 100. Let’s examine the outcome of that scenario now.
Step 1>
Example data set: Column A represents my study hours, while Column B represents my overall grade.

Step 2>
Insert the =RSQ function in any cell that is close to your real data.

Step 3>
The range of the predictor variable must now be given as the first input.

Step 4>
Column B, the response variable data range, will be the next argument.

Step 5>
You can now view the result of our formula by pressing the enter key.

This is what we obtained: a “0.394” result, which indicates that the number of study hours may account for 39% of the difference in the marks.
You know, in my opinion, have a clear understanding of R2, its operation, and the reasons it is necessary for statistical projects including Google Sheets.
When I change the response variable values at random, you can also observe the impact on the R2 values.

How to Find R2 in Google Sheets – Example# 3
One more example of raising your comprehension level. This example uses sample data that includes the total net worth of an independent contractor in the United States as well as the number of years of work.
Understanding the data is made easier by knowing the R2 value for this set of data, which also allows us to assess how well or poorly we can predict the response value using the predictor value.
Step 1>
Dummy Data.

Step 2>
Write the RSQ function in any cell.

Step 3>
Pass the complete range in the first argument, “Years of service,“

Step 4>
The net worth, shown by column B and spanning the whole range, is the second argument.

Step 5>
Once the calculation is finished, press the Enter key to see the value that results.

Thus, the result is 0.222, or 22.2% of the total. I think you already know how things turned out.
The value is “22.2%,” indicating that the number of years the contractor has provided service can account for 22.2% of the variation in the “Net worth.“
The reason for the variations in the values and the combinations of values across two columns—three instances that I gave you—is that they are somewhat similar in nature but always provide distinct outcomes. This is how R2 functions. As you can see, locating R2 in Google Sheets is simple, but comprehending the underlying idea is crucial, which is why I focused on the fundamentals in the introduction.
I hope you now understand what R2 is and where it can be found in Google Sheets.
You may also like>>> How To SUM A Column And Row In Google Sheets
Key Notes
- When the response variable is zero or very close to zero, the predictor variable is unable to explain the response variable in any way.
- If the response variable can be accurately and completely described by the predictor variable using any method, it has a value of 1 or very close to 1.
- R2 can alternatively be expressed as r2, R-squared, RS, or RSQ. Since it is the function name, we refer to it as RSQ in Google Sheets.
- As we saw in our practice examples, you will likely never see an absolute 0 or 1 for R2. Instead, you will see some mid-values between 0 and 1.

- If you give the RSQ function two single values as parameters, an error will result.


Frequently Asked Questions
What is a respectable R2 number?
Your objective for the regression model will determine the response to this query.
There are two most likely goals.
Are you trying to elucidate how the response variable and the predictor(s) relate to one another?
OR
Are you more keen to forecast the response variable?
Therefore, the response to the question “What is a good R2 value?” will vary based on your objectives.
What connection exists between the predictor variable and the response?
The R2 is largely meaningless if your main objective is to describe the relationship between the predictor(s) and the response variable.
Since we are using different data values on the same pattern of population data, let’s assume that in the regression model example from the previously taught examples, you can see that the coefficient for the predictor population size varies each time and that it is statistically valid. This indicates that an increase of ++1 in population size is linked to an average increase of 0.005 in the number of dairy shops in the United States. Keep in mind that one statistically significant predictor of the number of dairy stores in any given area is the population size.
You may also like>>> How To Use Google Finance Function In Google Sheets
Conclusion
R-squared, or R2 as it is more commonly known, is a fairly sophisticated statistical concept that we learned today. We attempted to understand the theory and reasoning behind this significant statistical or mathematical topic in addition to learning how to find R2 in Google Sheets using three distinct instances. I hope you now have the solutions to your queries. Stay in contact with Office Chaser for more helpful training and advice.